How did American's leisure activities change during the pandemic?
Collaborative UX and Research were conducted with colleagues. Research methods included journey maps, personas, user interviews, surveys, and usability tests.
Role Timeline
UX Designer Oct 2020 — Dec 2020
Research Purpose
The purpose of this research was to identify activities that people would be interested doing during the pandemic to overcome cabin-fever and screen fatigue.
Problem Space
These symptoms of cabin fever and screen fatigue have become common and many people have been experiencing them through the duration of the current pandemic. People now more than ever understand the importance of social distancing and staying healthy during the cold and flu season. There needs to be a platform that offers affordable events which promote healthy activity and covid safe precautions.
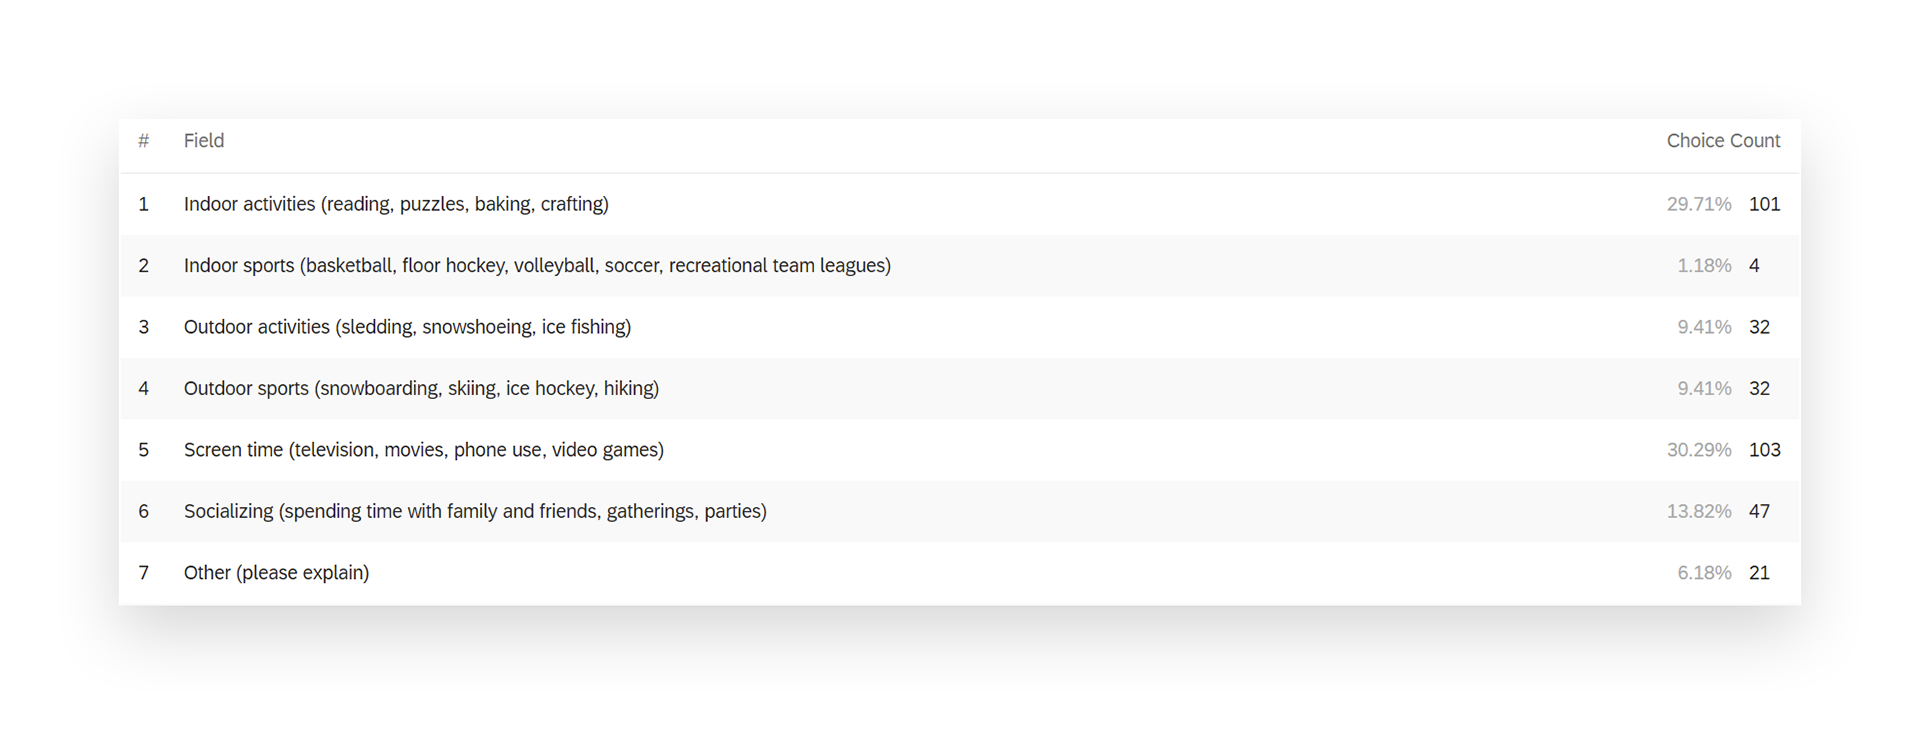
Survey Analysis — Participants anticipated to engage in more sedentary activities during the winter.
Discovery
After the team conducted separate interviews with similar questions, we reconvened to analyze the qualitative data. I decided we should color coordinate the main topics we were looking for in the interviews within Google Sheets. Then within those color-coordinated topics, find themes of similar activities. The team then constructed two Persona's named Taylor and Alex that were backed by data from the interviews and surveys. When those Persona's were finished, I created a Journey-Map for the Taylor persona. This Journey-Map contains two sides, 'As-Is,' which shows the Persona's current predicament, while 'To-Be' shows what scenario they wish for. These two faces of the journey map further helped our team to form empathy.
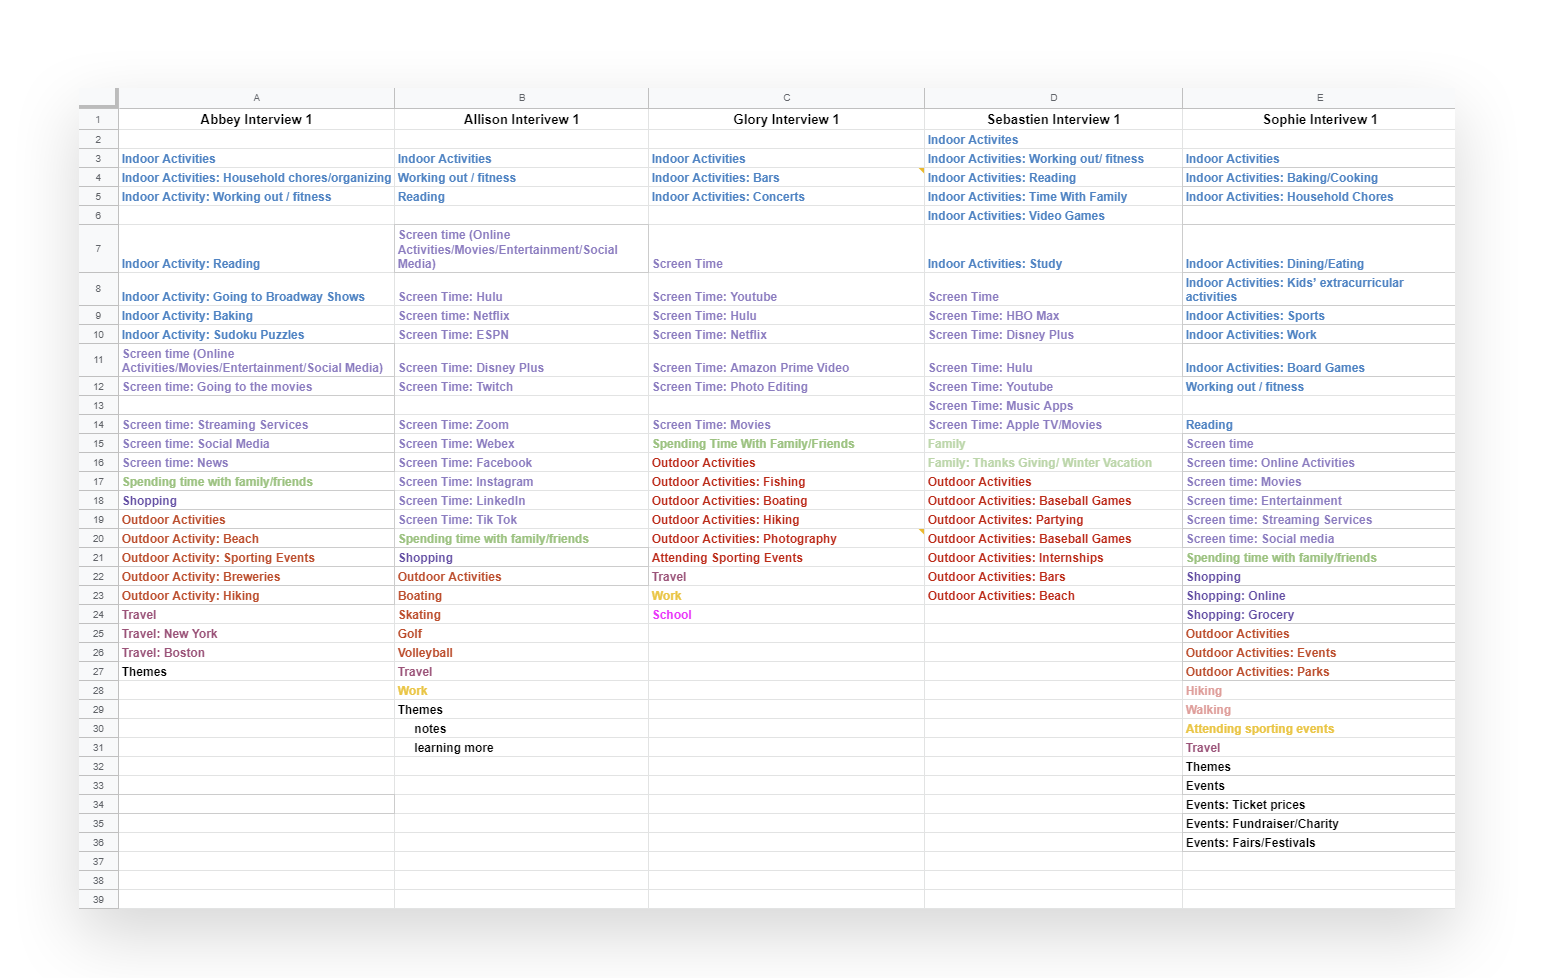
Interview Qualitative Analysis
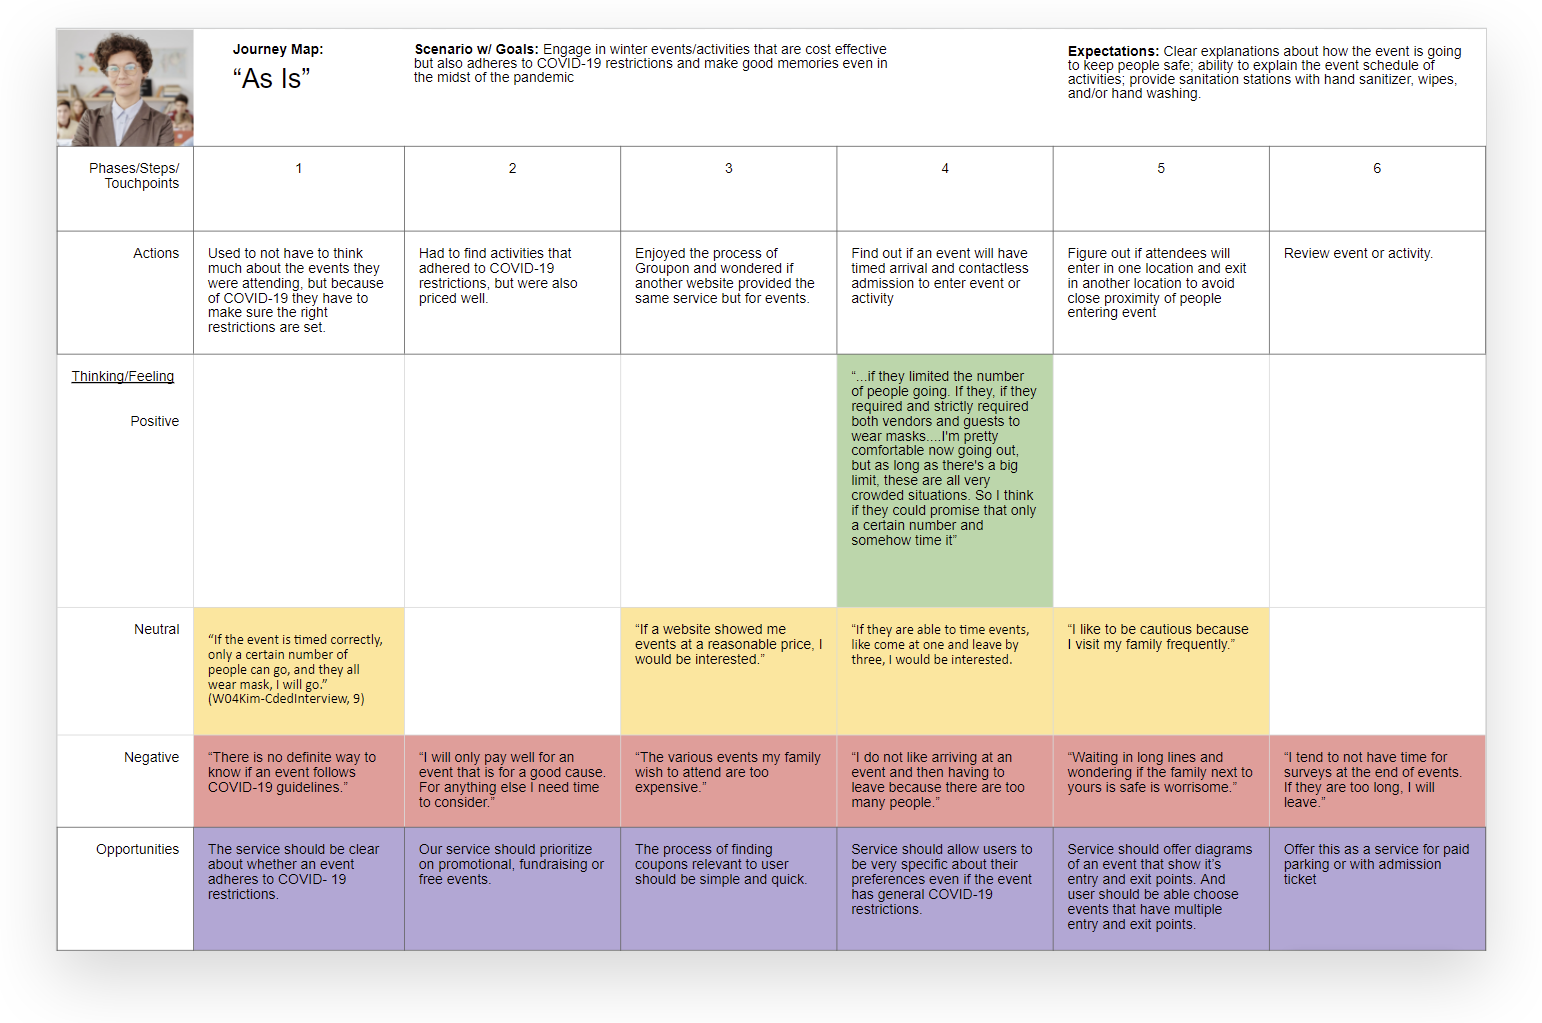
Journey Map — This an example of the journey map I created. The 'As-Is' slide is accompanied by a 'To-Be' in the full research document.
Findings
User interviews (n=6) showed anecdotal evidence for a change in overall entertainment habits over the course of the current pandemic. This included the cessation of high-risk group activities, a change in hobbies, as well as an alteration in the consumption of media. These topics were pursued further in user surveys (n=112) that were distributed to users between the ages of 18-65. Surveys validated interview data that users are spending much less time in social gatherings than prior to the pandemic, and are partaking in sedentary hobbies much more frequently. Surveys also confirmed an increase in screen time and media consumption among users.
Lo-Fi Wireframes
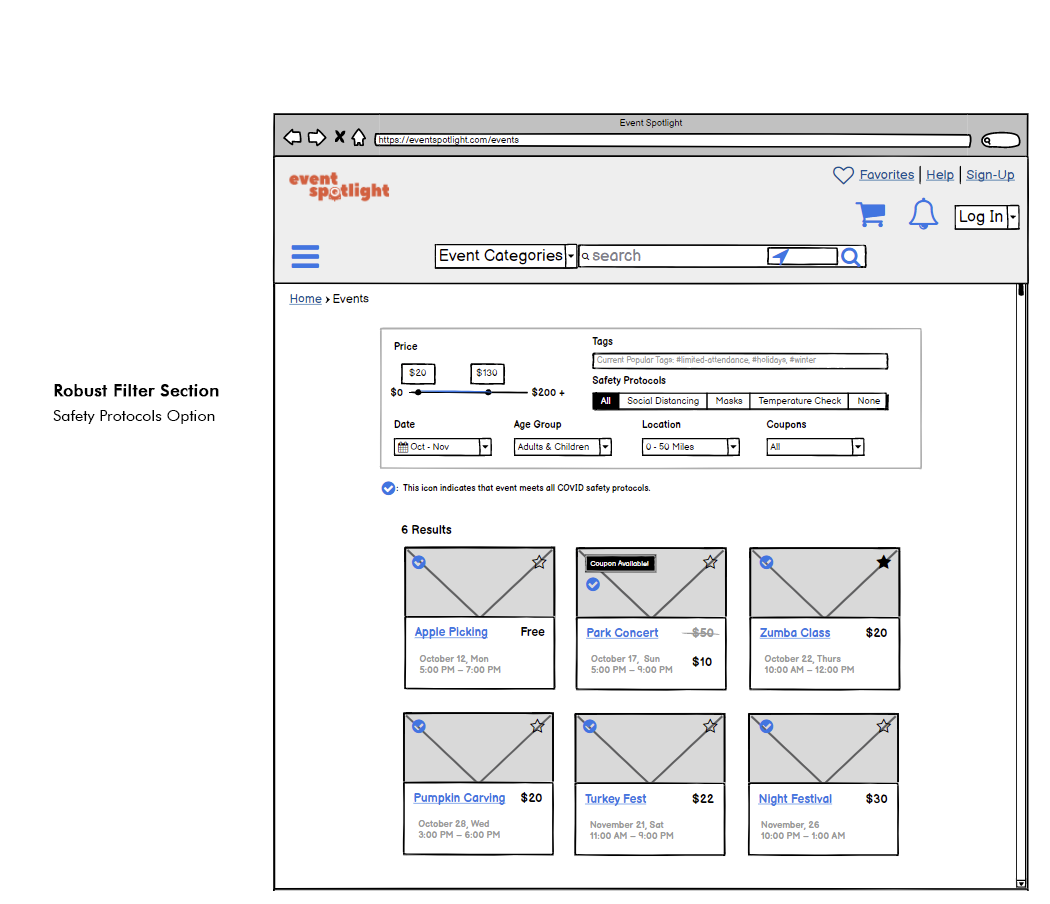
Data from usability tests, user-interviews, and surveys, allowed the research team to create a platform through low-fidelity wireframes. The major findings of the usability tests showed there was an appreciation for filtering options, a need for labeling elements, and refinement of the navigation.
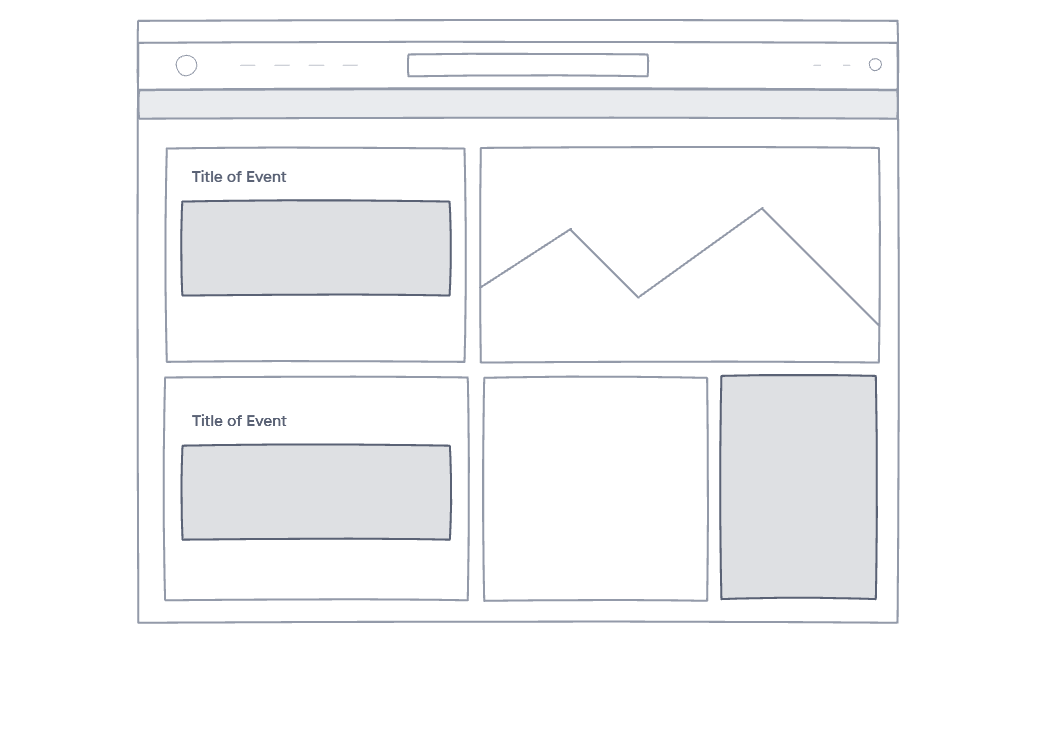
Low Fidelity Wireframes — Discover page.
Low Fidelity Wireframe — Search page
Hi-Fi Wireframes
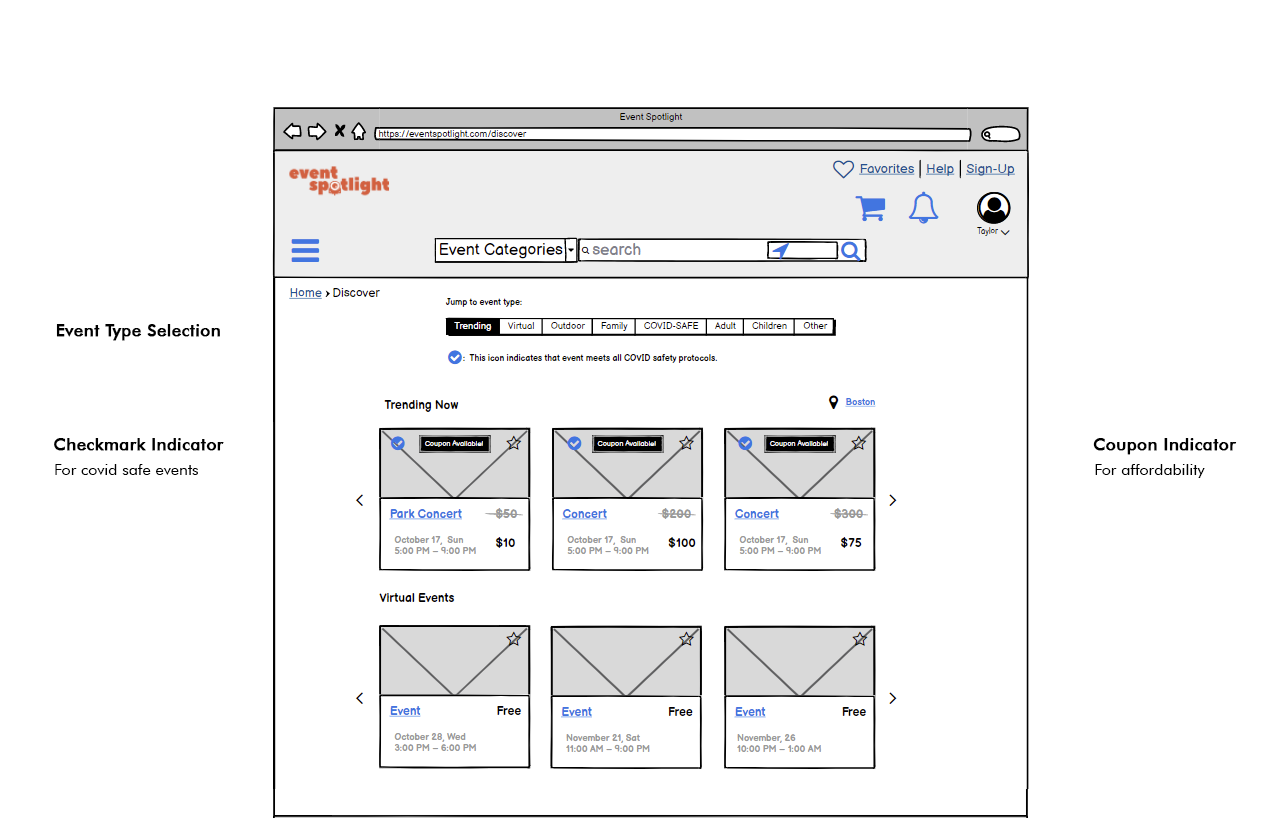
When usability issues were solved and refined, my main observation throughout various iterations and user tests was that participants indeed wished to find new events and learn hobbies but with slight hesitation due to covid. Even if a tag denoted the safety measures an event administrator took, participants always commented on some aspect of covid. I designed new High-Fidelity wireframes to address this hesitation. I decided on two new features that should help a user to choose more outdoor and active events.
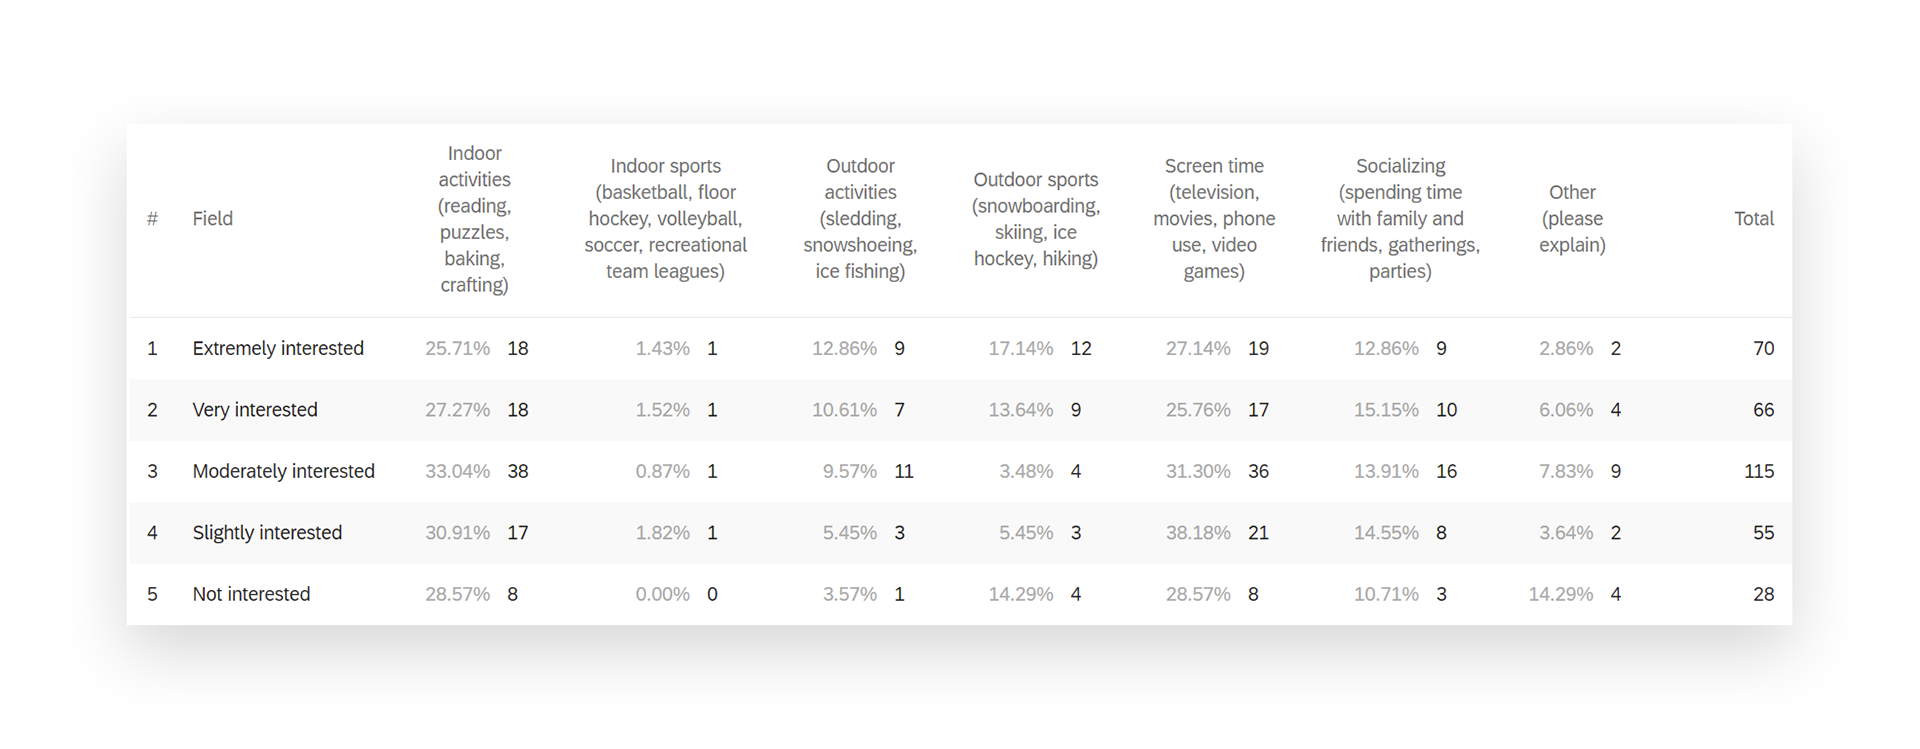
Survey Analysis — Observation is backed by data, participants show more overall interest in engaging in new activities.
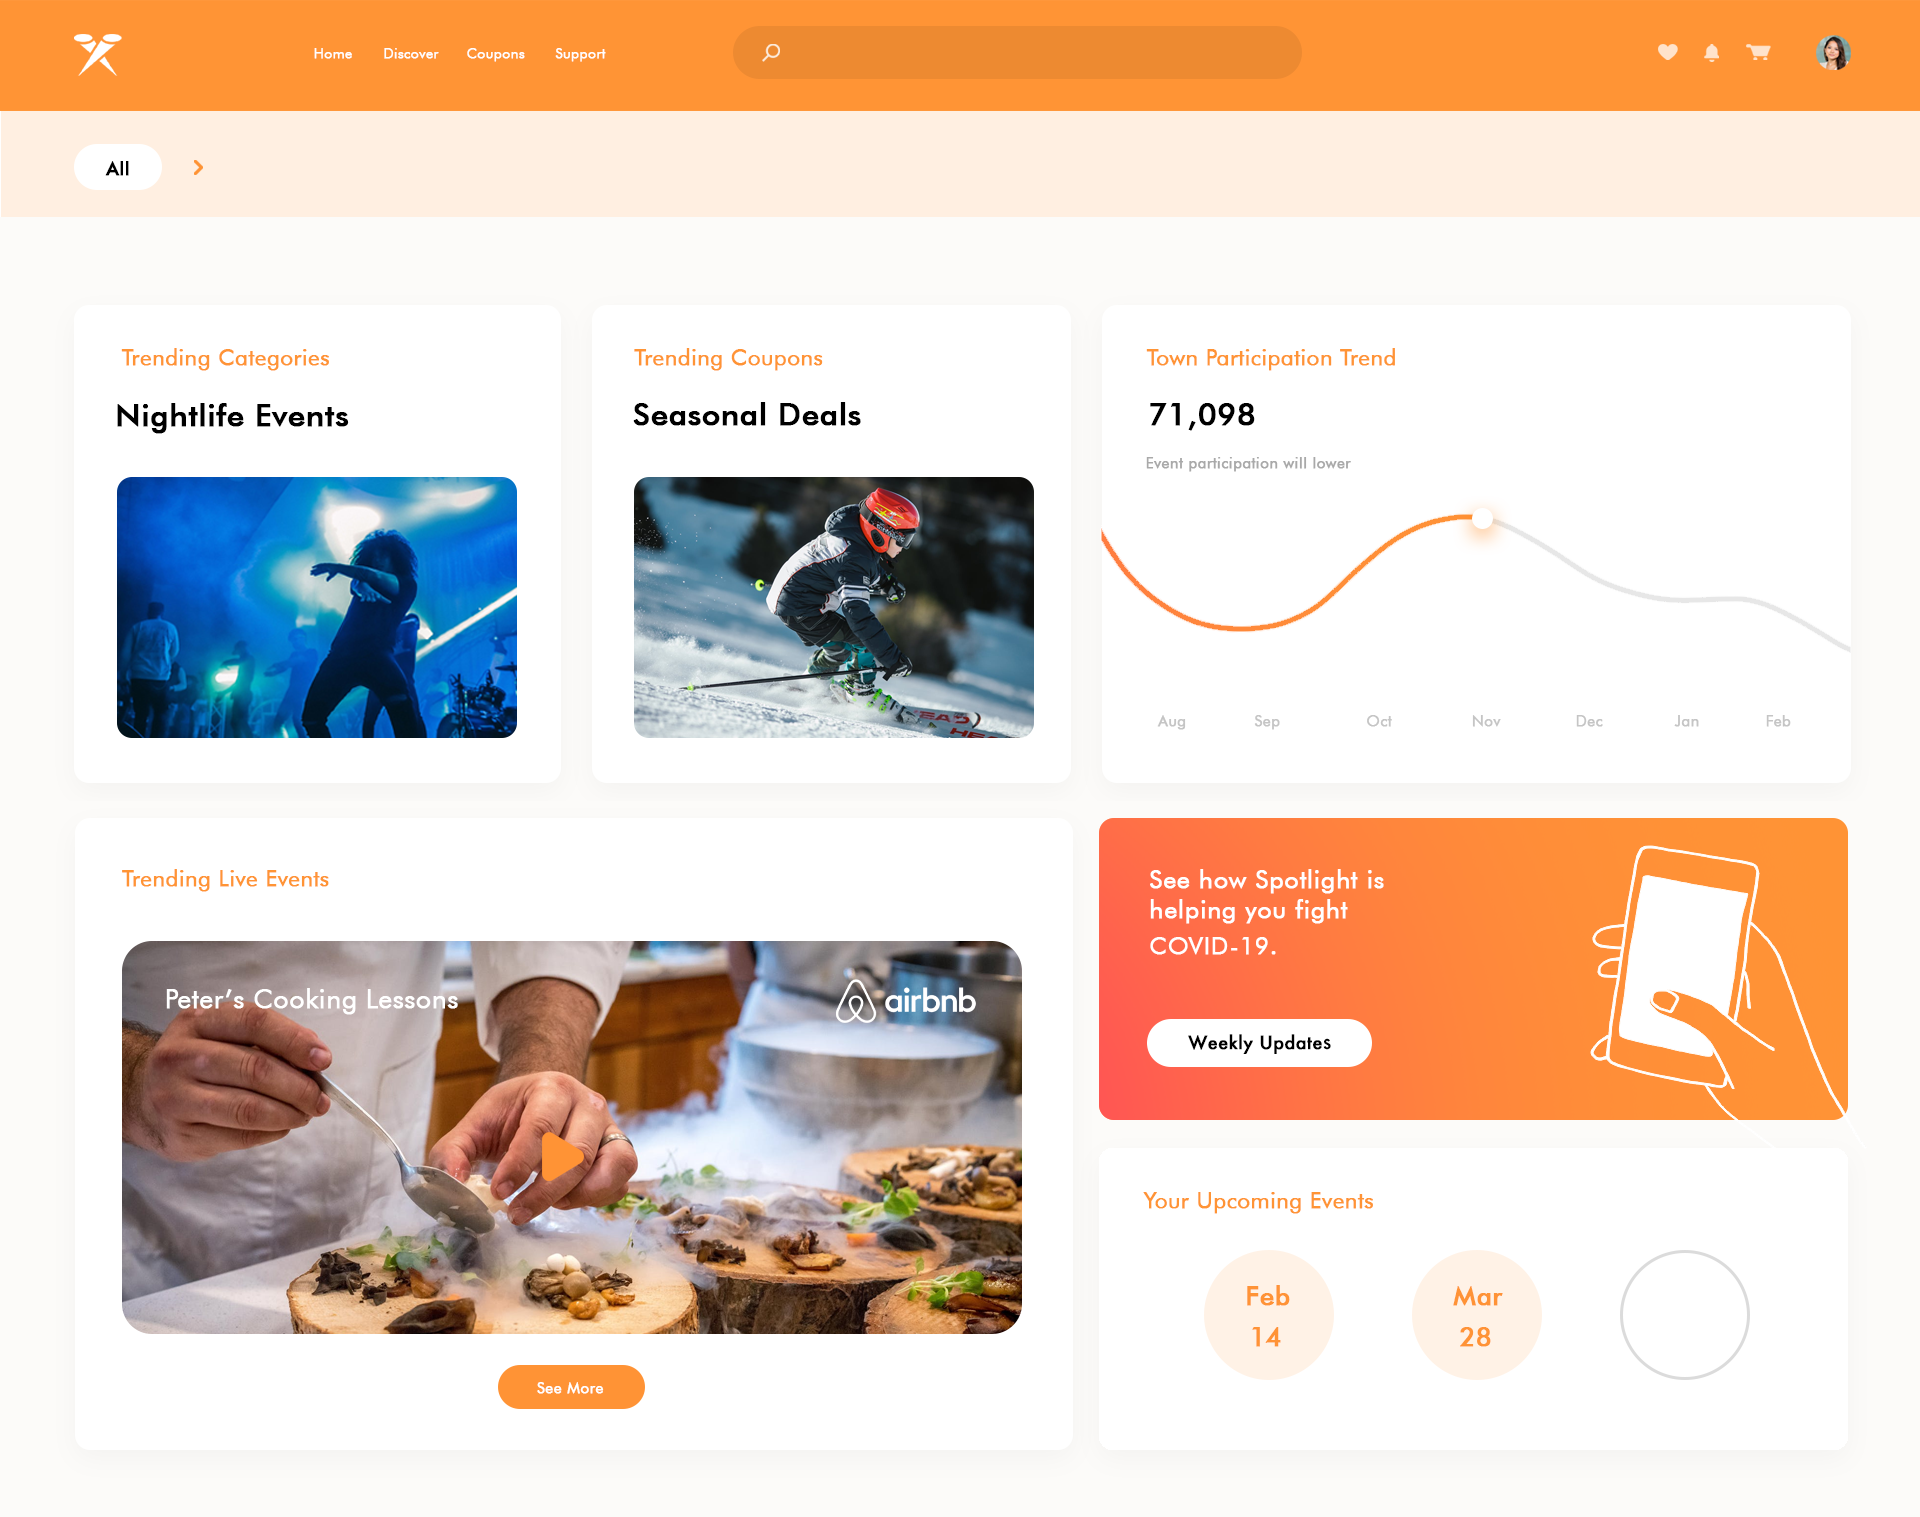
Town Participation Trend
The feature, 'Town Participation Trend,' intends to show the number of users on the platform currently attending events and forecast a trend in the coming months.
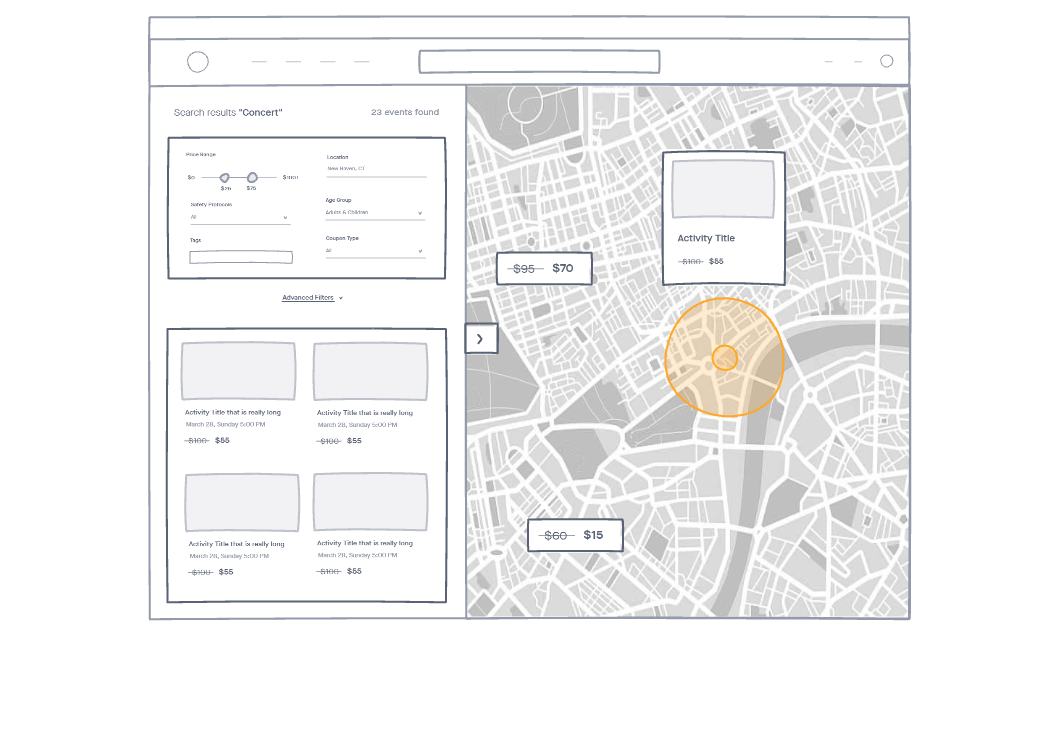
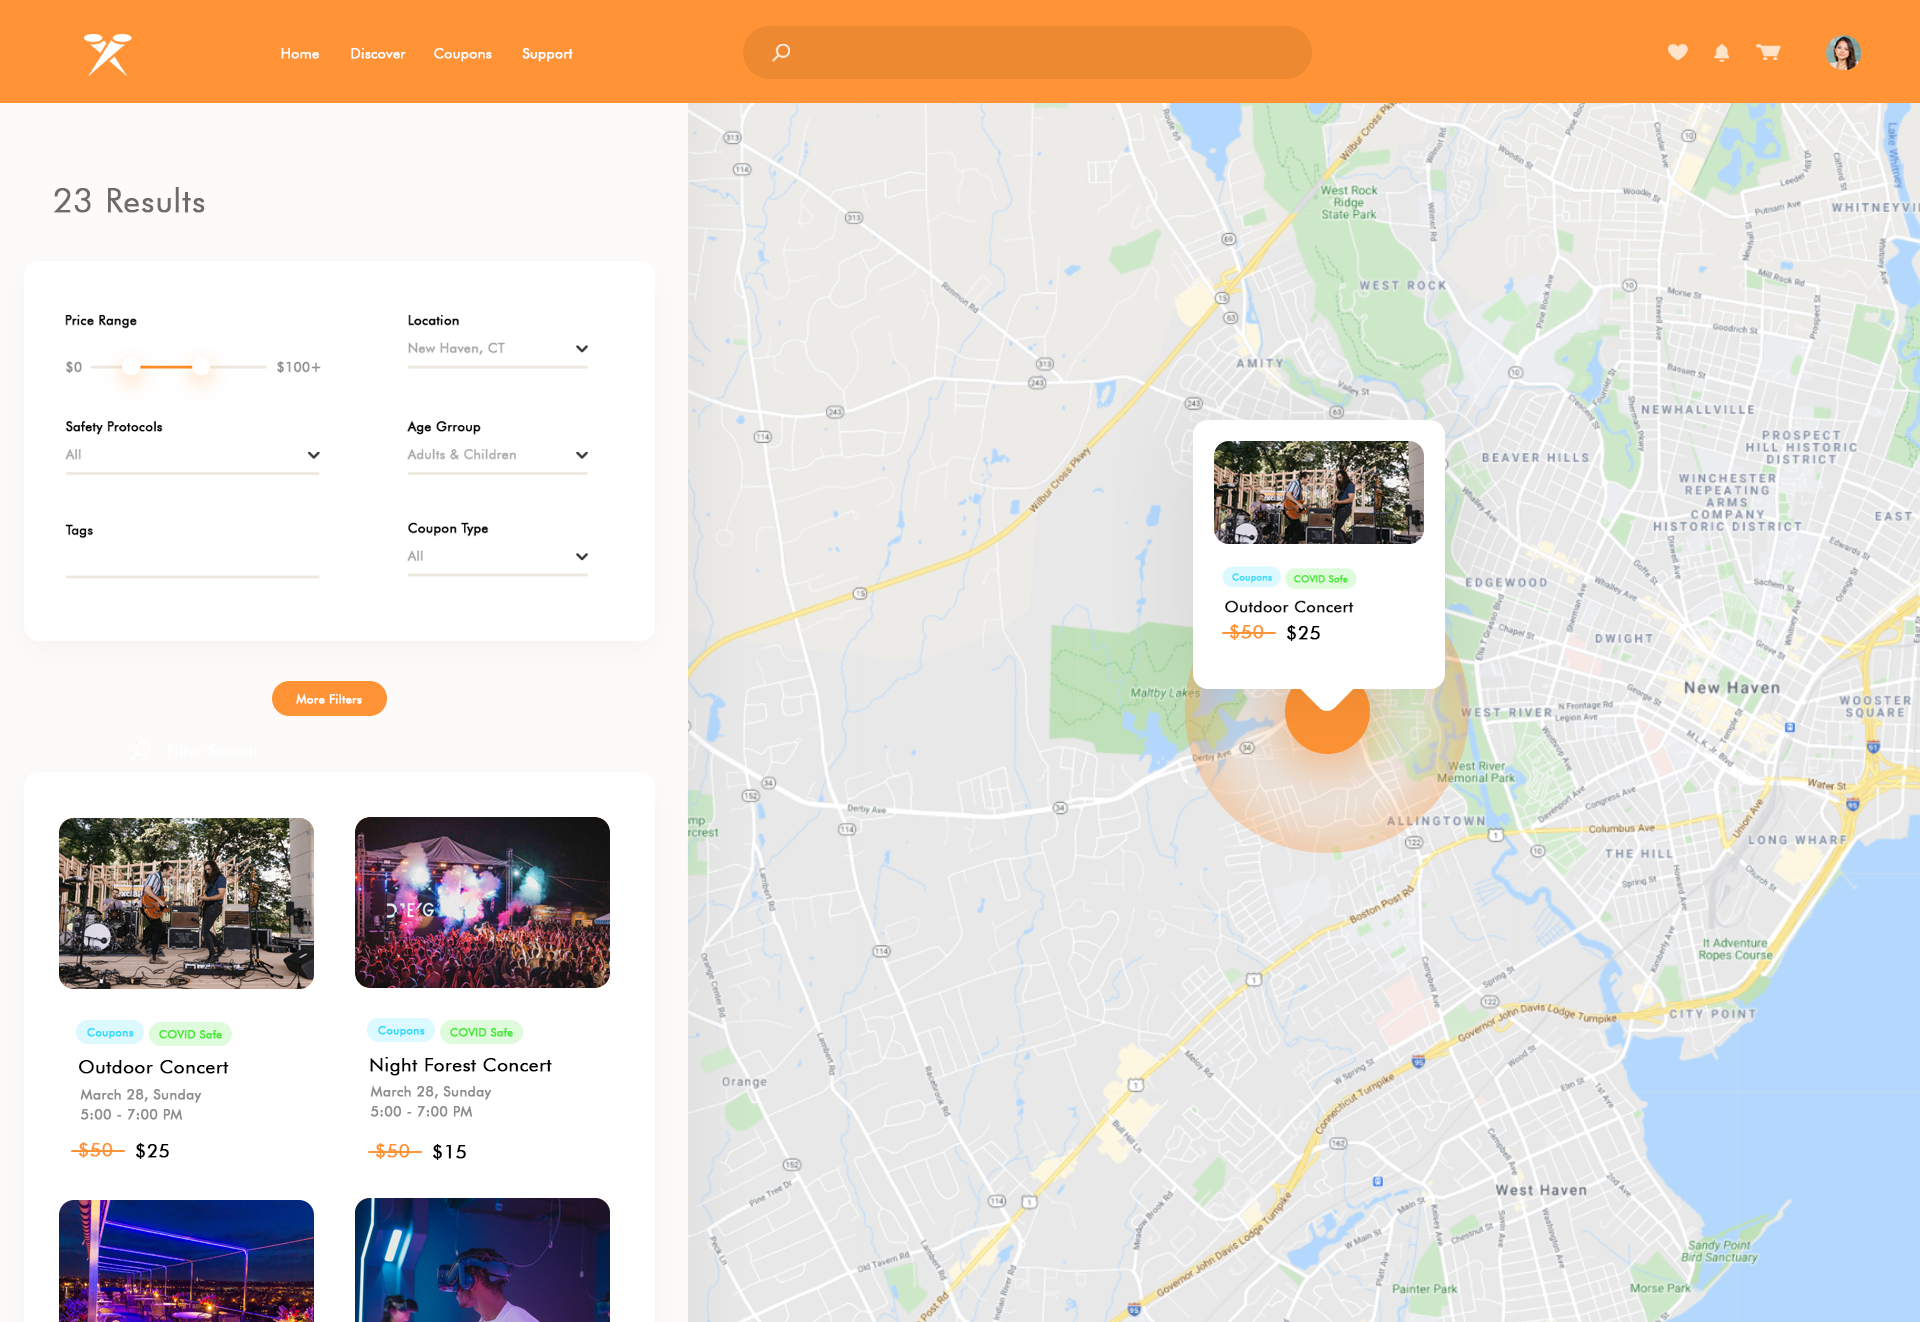
Event Radius
The feature 'Event Radius' intends to show the area that may be affected due to an event. This feature is for cautious users who want to see what events are happening near them and what places to avoid.